
By Dr Hope Iyamu
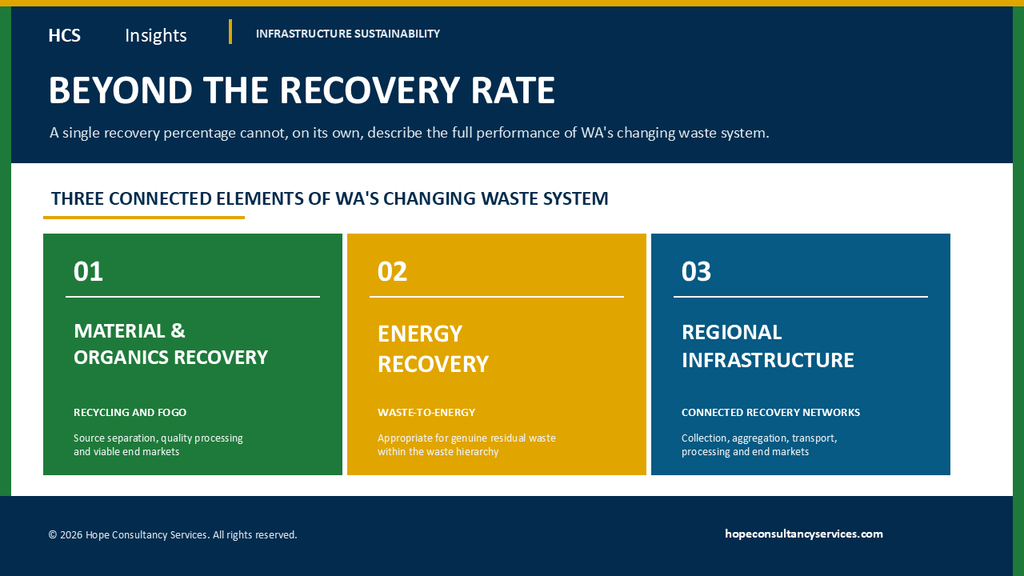
Western Australia now has a clearer picture of how its waste system is changing.
The Waste Authority's latest 2024 - 2025 waste and recycling data, updated in September 2026, show a system in transition, but not one progressing evenly across materials, technologies or regions.
WA generated approximately 7.5 million tonnes of waste, around 200,000 tonnes more than the previous year. Approximately 4.7 million tonnes were recycled, 146,000 tonnes recovered as energy, and 2.7 million tonnes disposed of to landfill.
Yet these statewide figures need context.
WA's recycling rate fell from 65% to 62%, while the overall recovery rate, including energy recovery, fell from 66% to 64%. At the same time, energy recovery increased by almost 200%.
Geography also matters. Landfill disposal decreased by approximately 45,000 tonnes in Perth and Peel, while increasing by approximately 228,000 tonnes outside the metropolitan area.
These figures do not demonstrate that WA's waste strategy is failing, nor that any single recovery technology is responsible.
They reveal something more important:
A single recovery percentage cannot, on its own, describe the full performance of an increasingly complex waste system.
As WA moves towards a more circular economy, the distinction between recycling, organics recovery, energy recovery, landfill diversion, regional access and preservation of material value becomes increasingly important.
A Changing Waste Profile
WA generated approximately 7.5 million tonnes of waste in 2024 - 2025, compared with about 7.3 million tonnes in 2023 - 2024.
The largest contributor to the increase was an additional 0.2 million tonnes of construction and demolition (C&D) waste disposed of.
Longer-term trends are also revealing. Overall waste generation increased from 2,466 kg per person in 2014 - 2015 to 2,569 kg in 2024 - 2025, while municipal solid waste (MSW) generation moved in the opposite direction, falling from 625 kg to 483 kg per person.
The distinction matters. WA's waste challenge cannot be understood simply by looking at household bins. Construction, commercial and industrial activity remain major determinants of statewide performance.
Recycling Fell as Energy Recovery Accelerated
WA's recycling rate decreased from 65% in 2023 - 2024 to 62% in 2024 - 2025.
C&D remained by far the largest recycling stream, with approximately 3.3 million tonnes recycled. Approximately 1.0 million tonnes of commercial and industrial (C&I) waste and 0.4 million tonnes of MSW were also recycled.
But the composition of those streams was markedly different. Organics represented 54% of recycled MSW, metals represented 68% of recycled C&I waste, while C&D recovery was dominated by mixed C&D material, sand, soil and concrete.
The State's 62% recycling rate is therefore not one homogeneous recycling system. It is the combined outcome of fundamentally different materials, infrastructure systems, markets and economic drivers.
Where recovered material ultimately goes matters too. Approximately 78% (3.7 million tonnes) was reprocessed within WA; around 21% (1.0 million tonnes), was sent overseas; and approximately 0.1 million tonnes went interstate.
All recovered C&D material was reprocessed within WA, while approximately 82% of recovered C&I material was exported, largely reflecting the significance of scrap metal.
The principle is straightforward:
Collection is only the beginning of resource recovery.
If separated material cannot be economically processed, sold or productively reused, the recovery chain remains incomplete.
Energy Recovery Changes the Picture
Approximately 146,000 tonnes of waste were recovered as energy in 2024 - 2025, an increase of almost 200% from the previous year, driven largely by the commencement of large-scale waste-to-energy operations.
Of this, 65% came from MSW, 32% from C&I waste and 3% from C&D waste. General waste from kerbside bins represented approximately 61% of all waste recovered as energy.
Energy recovery can reduce direct landfill disposal and has an established position within the waste hierarchy for appropriate residual waste.
But it is not material recycling.
That distinction becomes particularly important because approximately 126,000 tonnes of non-residual waste were sent to energy recovery during the year. According to the Waste Authority, most came from local governments that did not provide a three-bin FOGO kerbside system.
This does not establish that the material could automatically have been recycled, nor that waste-to-energy caused the loss of recyclable material.
It does demonstrate why source separation, and energy recovery cannot be considered independently.
If food and garden organics remain in the residual bin because FOGO is unavailable, those materials may enter energy recovery before higher-order organics recovery has been maximised.
That is precisely why the waste hierarchy matters.
FOGO: Strong Performance, but Infrastructure Matters
FOGO provides one of the clearest signals in the latest data.
FOGO recycling increased by almost 25% in 2024 - 2025. Three-bin systems incorporating FOGO achieved an average recycling rate of 55%, compared with 21% for two-bin systems without organics composting. Some local governments operating FOGO achieved kerbside recovery rates of up to 79%.
But FOGO also demonstrates why policy cannot be separated from infrastructure.
Regional FOGO collection and processing were disrupted for some local governments during 2023 - 2024 and 2024 - 2025, with contamination identified as a major contributing factor.
A functioning system requires an entire pathway:
Collection → Contamination Control → Aggregation → Transport → Processing → Quality Product → Viable End Market
Failure at one point can compromise the whole pathway.
For regional WA, the engineering question is therefore broader than the question of whether FOGO is desirable. It is whether the processing capacity, catchment, transport system, contamination controls and infrastructure redundancy exist to sustain it.
A green bin is only the visible front end of a much larger infrastructure system.
Metropolitan and Regional WA Are Moving Differently. Approximately 2.7 million tonnes of waste were landfilled across WA in 2024 - 2025, around 200,000 tonnes more than the previous year.
But the increase was not evenly distributed.
Landfill disposal in Perth and Peel decreased by approximately 45,000 tonnes, while disposal outside the metropolitan area increased by approximately 228,000 tonnes.
The Waste Authority attributes much of the regional increase to C&D and C&I waste, including material associated with landfill-cell closures, contaminated soil and mining and oil-and-gas remediation projects. It should therefore not be interpreted simply as deterioration in regional household recycling performance.
Nevertheless, the geographic contrast is significant.
Perth and Peel increasingly have access to large-scale material recovery, organics processing and energy-recovery infrastructure. Regional and remote WA operate over longer distances, with smaller waste catchments, lower aggregation volumes and fewer processing options.
The same statewide policy objective can therefore require very different infrastructure solutions.
The metropolitan system also has further to travel. The Waste Strategy's Protect target is for no more than 15% of waste generated in Perth and Peel to be landfilled by 2030. In 2024 - 2025, approximately 27.5% (about 1.65 million tonnes) was still landfilled, compared with 49% in 2014 - 2015.
This reinforces another important point: adding recovery capacity does not automatically produce equivalent movement in the overall recovery rate when total waste generation is also changing.
Regional WA Needs a Different Infrastructure Conversation
The latest data strengthen the case for a more deliberate regional waste-infrastructure strategy.
The answer is unlikely to be simply replicating metropolitan infrastructure on a smaller scale. In many communities, distance, throughput and economics will not support that approach.
Regional planning, therefore, needs to ask:
- What materials can realistically be aggregated across neighbouring local governments?
- What processing scale is technically and commercially viable?
- When does long-distance transport remain preferable to local disposal?
- What happens when the only regional processor becomes unavailable?
- Can transfer stations, baling, compaction, or back-haul improve logistics?
- Where are the viable end markets?
- Does the recovery pathway still deliver a better lifecycle outcome after transport and processing are considered?
These are infrastructure-planning questions, not simply recovery-target questions.
There are encouraging signs. In July 2026, more than $3.7 million in Recycling Modernisation Fund grants were announced for 16 regional and remote local governments, targeting collection, sorting, storage and processing infrastructure for materials including plastics, paper, cardboard and tyres.
That investment is valuable.
But the longer-term question is bigger:
What network of aggregation, transfer, processing and end-market infrastructure does regional Western Australia actually need?
That question shifts the conversation from individual projects towards regional recovery systems, how materials move between communities, where they are aggregated, where processing capacity should sit, and how viable end markets are connected to the infrastructure network.
For regional WA, building connected recovery networks may ultimately be more effective than attempting to replicate metropolitan infrastructure on a community-by-community basis.
Recovery Rates Need Context
Recovery targets remain important. They establish direction, support accountability and provide a basis for measuring progress.
As WA's waste system becomes more complex, there is value in considering its performance through a broader set of measures.
Such an assessment can distinguish between:
Waste Avoided → Material Recycled → Organics Recovered → Energy Recovered → Residual Waste Landfilled
Geography and waste stream should also remain visible. A statewide recovery rate can conceal major differences between metropolitan and regional systems. At the same time, an increase in contaminated soil from remediation activity should not be interpreted in the same way as deterioration in household recycling performance.
Over time, transport distance, processing efficiency, recovered-material quality, end-market utilisation and lifecycle impacts should increasingly form part of the performance conversation.
Together, these measures can provide a more complete picture of circular-economy performance than any single percentage viewed in isolation.
The HCS Perspective
The 2024 - 2025 data reveal a Western Australian waste system undergoing significant structural change.
Large-scale energy recovery has commenced. FOGO is demonstrating substantially stronger kerbside recycling performance. C&D remains the dominant recycling stream but contributed materially to the latest decline. Regional landfill disposal has increased due to factors strongly influenced by industrial, construction, and remediation activities. And significant quantities of residual-bin material continue to move directly to landfill.
There is progress in this picture.
There are also clear infrastructure gaps.
The important point is not to reduce these changes to a contest between technologies or individual recovery percentages. Different waste streams require different pathways, and those pathways depend on infrastructure.
Waste-to-energy performance should not be understood solely in terms of tonnes diverted from landfill.
FOGO performance extends beyond the number of green bins distributed.
Regional recycling performance needs to be understood in the context of regional infrastructure and geographic conditions, rather than through metropolitan recovery rates alone.
And recycling is not complete simply because material has been collected.
Each pathway depends upon an infrastructure chain:
Collection → Aggregation → Transport → Processing → End Market
Every link matters.
Collection without processing capacity creates another logistics problem. Processing without viable end markets does not complete the circular pathway. Recovery that depends on unsustainable transport distances may not deliver the broader environmental and resource-recovery outcomes implied by the reported recovery rate.
The entire pathway must therefore make technical, environmental and economic sense.
That is where policy ambition becomes infrastructure performance.
And it reinforces a principle that has emerged repeatedly through HCS analysis of WA's changing waste system:
It is not about selecting the most impressive solution. It is about doing what is technically justified.
Beyond the Recovery Rate
WA's latest waste data provide something more useful than a scorecard. They show us where to ask better questions.
Why did recycling fall while energy recovery increased?
Why are FOGO systems substantially outperforming two-bin systems?
Why did landfill disposal decline in Perth and Peel while increasing significantly in regional WA?
How much material entering energy recovery is genuinely residual?
Where does recovered material ultimately go?
And do regional communities have access to the infrastructure required to deliver the outcomes expected by statewide policy?
These are not questions about whether one technology is inherently better than another. They are questions about whether the whole waste system is functioning as intended.
That distinction can help inform the next phase of WA's waste transition, because the objective is not simply to move tonnes from landfill into another statistical category.
It is to build a system that avoids unnecessary waste, preserves material value wherever practical, recovers organics effectively, uses energy recovery appropriately for genuine residuals, manages unavoidable disposal responsibly, and works across the geographic realities of Western Australia.
A circular economy, therefore, requires more than a high recovery percentage.
It requires the right material to move through the right pathway, supported by infrastructure that can collect, aggregate, transport, process and return resources to productive use.
A circular economy is not demonstrated by moving tonnes from one column to another. It is demonstrated by preserving material value and improving the overall system performance.
That is what lies beyond the recovery rate: the infrastructure, geography and material pathways that ultimately determine how the waste system performs.
Further Reading
- Waste Authority Western Australia - Key findings: Annual Waste and Recycling Data 2024 - 2025. Updated 22 September 2026.
- Waste Authority Western Australia - Waste Generation: Annual Waste and Recycling Data 2024 - 2025. Updated 21 September 2026.
- Waste Authority Western Australia - Waste Recovery: Annual Waste and Recycling Data 2024 - 2025. Updated 21 September 2026.
- Waste Authority Western Australia - Waste Disposal: Annual Waste and Recycling Data 2024 - 2025.
- Waste Authority Western Australia - Local Government Waste Services: Annual Waste and Recycling Data 2024 - 2025. Updated 21 September 2026.
- Waste Authority Western Australia - Waste Strategy Targets: Annual Waste and Recycling Data 2024 - 2025. Updated 21 September 2026.
- Waste Authority Western Australia - Outcomes of the Waste Authority Meeting Held on 22 July 2026. Published 7 August 2026.
- HOPE Consultancy Services - Dr Hope Iyamu, Beyond Landfill Diversion: What East Rockingham Waste-to-Energy Means for Western Australia's Waste Hierarchy, HCS Insights, September 2026.
- HOPE Consultancy Services - Dr Hope Iyamu, Fit-for-Purpose Engineering: The Bridge Between Circular Economy Ambition and Infrastructure Performance, HCS Insights, 26 June 2026.
About the Author
Dr Hope Iyamu is a Civil & Environmental Engineer, consultant, educator, and reflective author. Through HCS Insights, he writes on engineering judgement, infrastructure governance, sustainability, environmental leadership and the practical decisions that shape resilient infrastructure.
As Principal Consultant at HOPE Consultancy Services, he provides independent technical advisory and strategic support across environmental governance, waste and wastewater infrastructure, regulatory compliance, sustainability and infrastructure decision-making.